1. Figure, rcParams
Figure 전체 그래프의 컨테이너 역할을 하는 최상위 객체이다. 여러 개의 서브플롯(Axes), lable, title, colorbar 등이 포함된다. plt.figure() 함수를 이용해서 이를 조정할수 있다. figsize를 인수로 크기를 지정할 수 있다.(인치)
rcParams 같은 경우는 맷플롯립 그래프의 기본값을 관리하는 객체이다.

figure 객체에는 여러가지 그래프(subplot)를 담을 수 있다. plt.subplots( rows, cols, index ) 함수를 이용해 서브플롯 객체를 생성할 수 있다. 리스트 접근하듯이 접근하면 사용할 수 있다.
fig, axs = plt.subplots(2, 1)
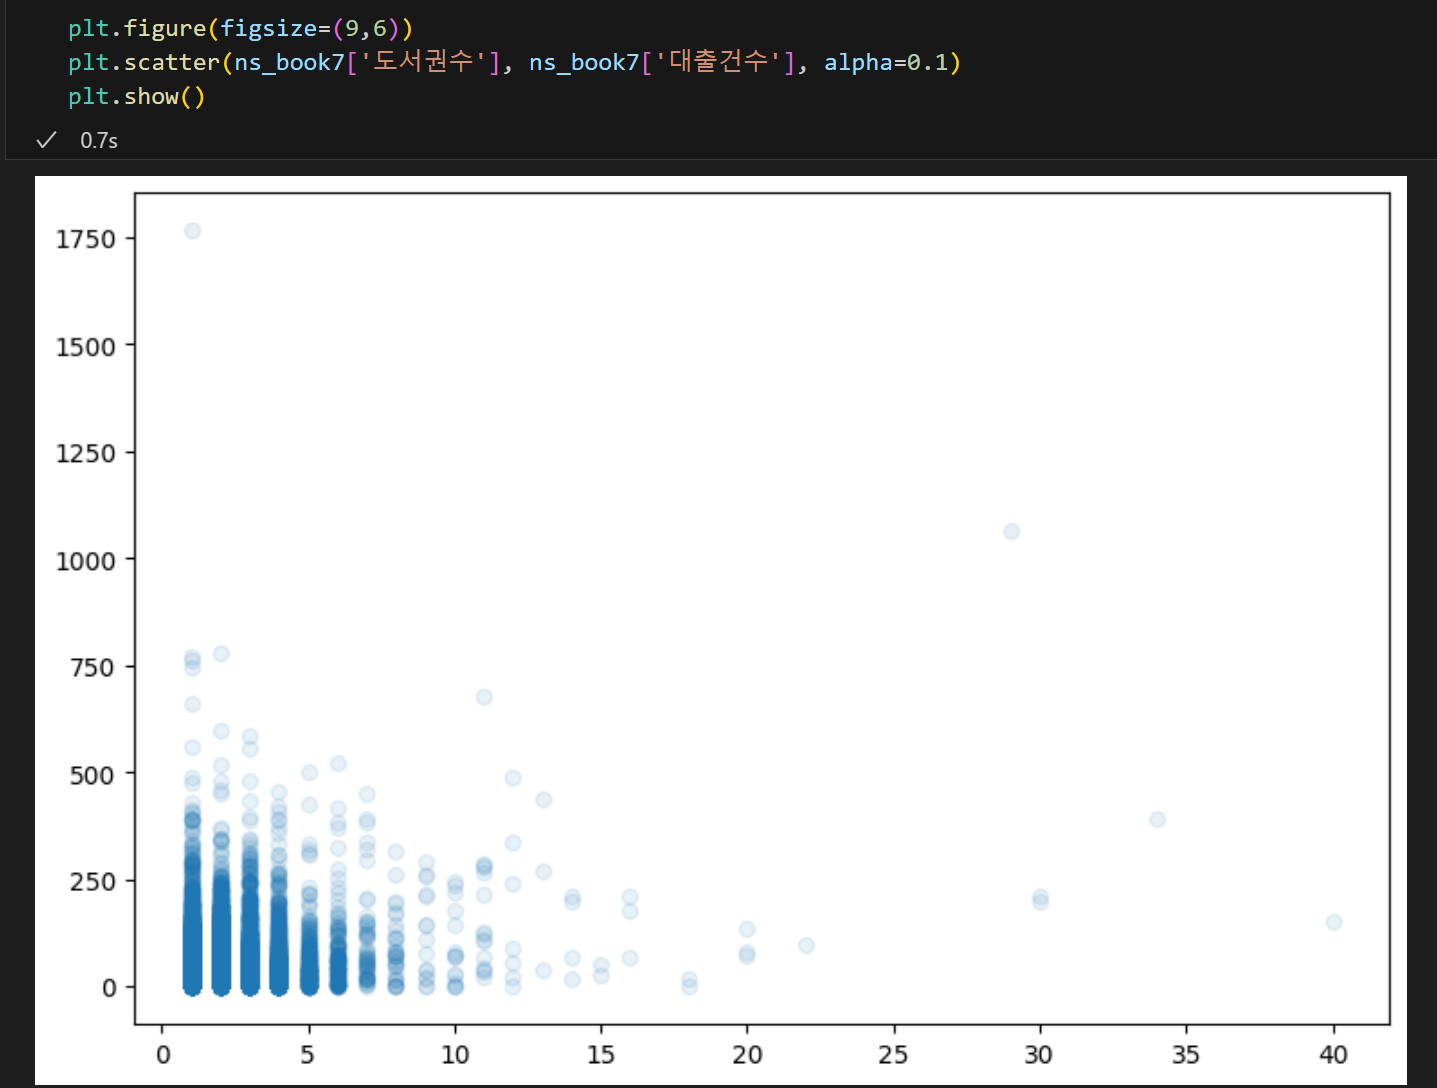
axs[0].scatter(ns_book7['도서권수'], ns_book7['대출건수'], alpha= 0.1)
axs[1].hist(ns_book7['대출건수'], bins = 100)
axs[1].set_yscale('log')
plt.show()
2. 선그래프
plt.plot()함수를 이용하면 선그래프를 그릴 수 있다.
plt.plot(count_by_subject.index, count_by_subject.values)
plt.title('Books by year')
plt.xlabel('year')
plt.ylabel('number of books')
plt.show()
3. 바 그래프, 숙제
plt.bar()함수를 이용하면 bar그래프를 그릴 수 있다.
plt.bar(count_by_subject.index, count_by_subject.values)
plt.title('Books by year')
plt.xlabel('year')
plt.ylabel('number of books')
for idx, val in count_by_subject.items():
    plt.annotate(val, (idx,val),xytext=(0,2), textcoords='offset points')
plt.show()
'혼자 공부하는 데이터 분석 with 파이썬' 카테고리의 다른 글
| [혼공 분석] 혼공 학습단 회고 (0) | 2025.02.23 |
|---|---|
| [혼공 분석] 다양한 그래프 그리기 (0) | 2025.02.23 |
| [혼공 분석] 데이터 분석 (3) | 2025.02.03 |
| [혼공 분석] Data cleaning (0) | 2025.01.22 |
| [혼공 분석] API, web scraping (4) | 2025.01.14 |


